Finances
The Finances section tracks money in and out of a project: budget, income, expenses, labor costs, recurring rows, approvals, and cash flow.
Cash flow
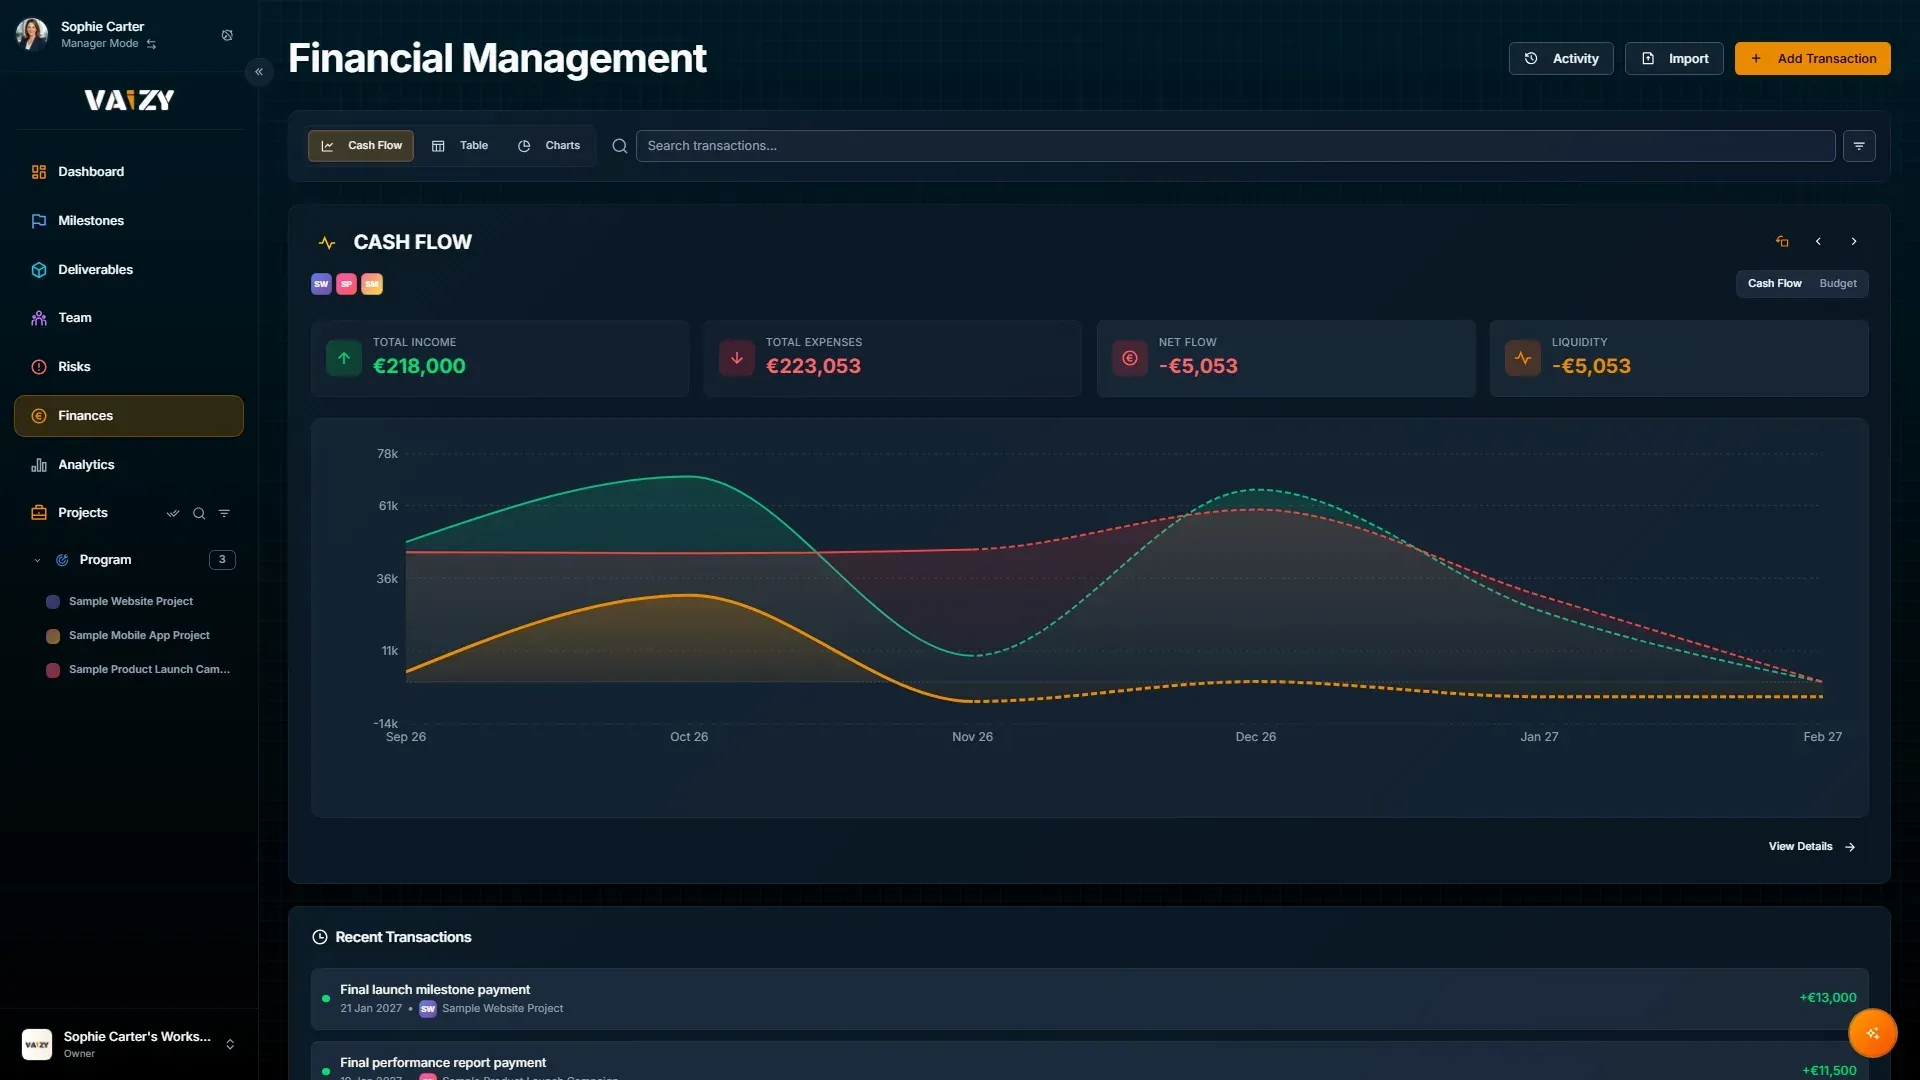
Cash flow shows income, expenses, net flow, and liquidity over time. Use it when a project looks healthy on delivery but cash is telling a different story.
The cash flow view also lists Recent Transactions. Click any one to jump straight to the table, scroll to that row, and highlight it so you can find it without searching. You can also reach a transaction from the keyboard by focusing it and pressing Enter or Space.
The Recent Transactions widget on the dashboard orders entries by when they were added, so future-dated recurring and salary rows do not push genuinely recent activity out of view. Each card also shows the related milestone when the transaction is linked to one. When you narrow the dashboard to a single project, the cards stop repeating that project's name on every row and only show it when it tells you something new.
Budget view
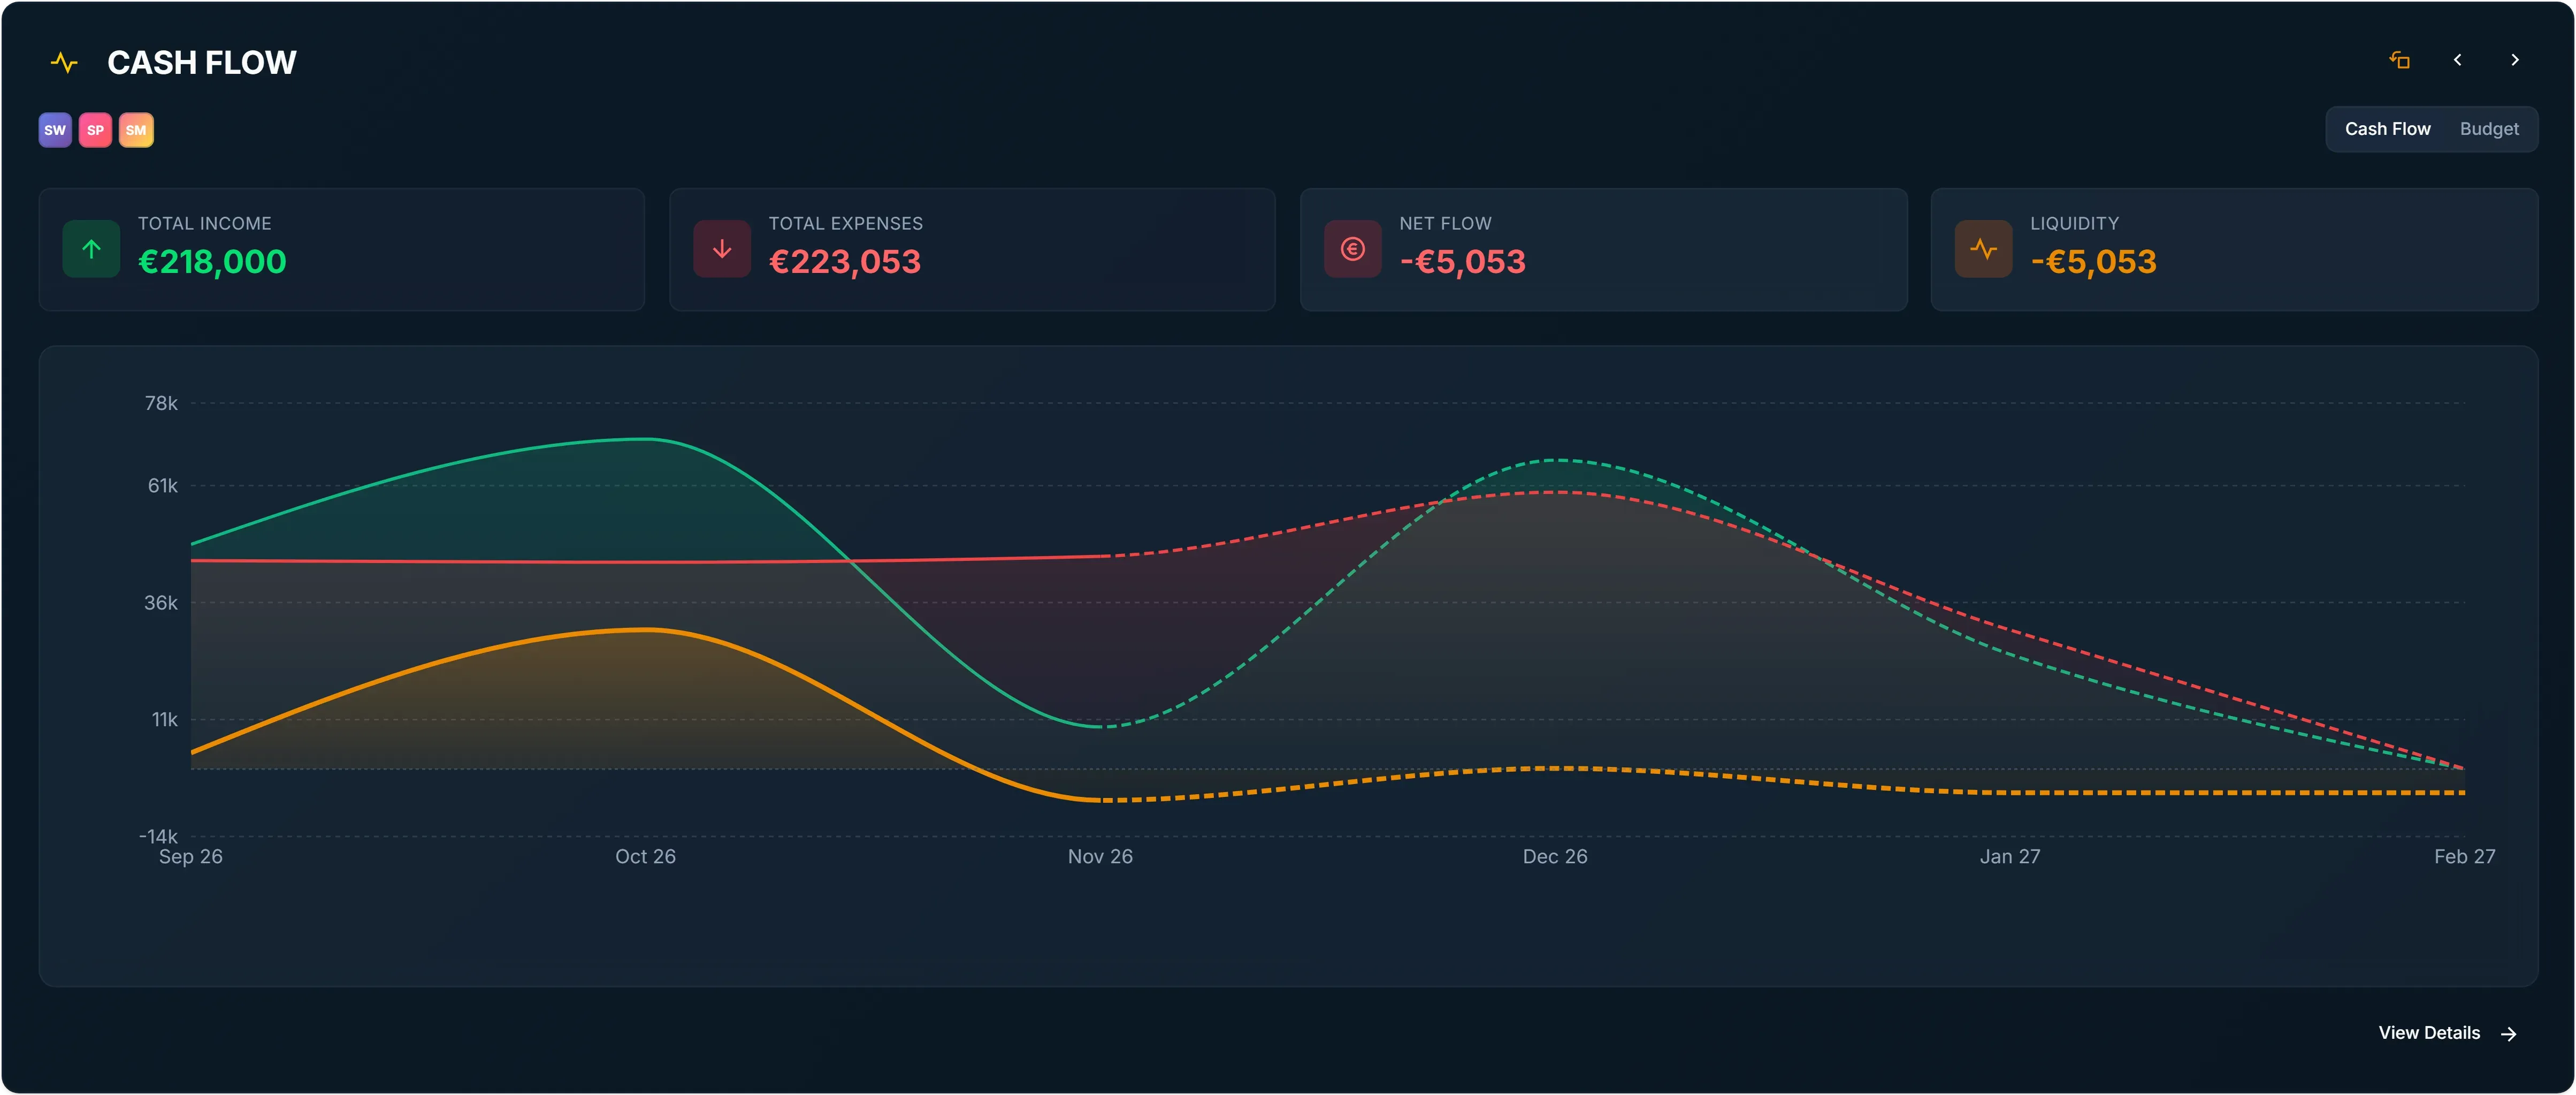
When the project (or every project you have selected) has a budget set, the dashboard Cash Flow widget gains a Cash Flow / Budget toggle in its header. Switch to Budget view to see spend to date plotted against a dashed budget line. If more than one project is selected, the budgets are combined. Hover any point and the tooltip shows how much budget remains, green when you are under budget and red when you are over. Budget view also shows Budget, Spent to Date, and Budget Remaining as summary cards on the Finances page. Spent to Date and Budget Remaining only count costs dated up to today, so future-dated rows don't eat into your remaining budget early. The same goes for every other place Vaizy reports spending, including Portfolio Health, roadmap status, earned value, monthly reports, Slack and Vaizy AI, so they all show the same number.
Latest Estimate
Latest Estimate answers "where will we end up?". It takes what you've actually spent so far and adds everything still planned, including recurring transactions, to forecast the project's final cost. You'll find it on the Finances page, as a dashboard widget, and as the Forecasted column in the projects table.
You can set which view opens first. Head to Settings > Preferences and pick Cash Flow or Budget under Finance Defaults — it sets the starting view for both the dashboard widget and the Finances page, though switching the toggle on either one flips both for the rest of your session. Cash Flow also remembers whether you were last looking at your own view or the shared workspace view and reopens on that, with a toggle to link or unlink it from the workspace default.
Transactions
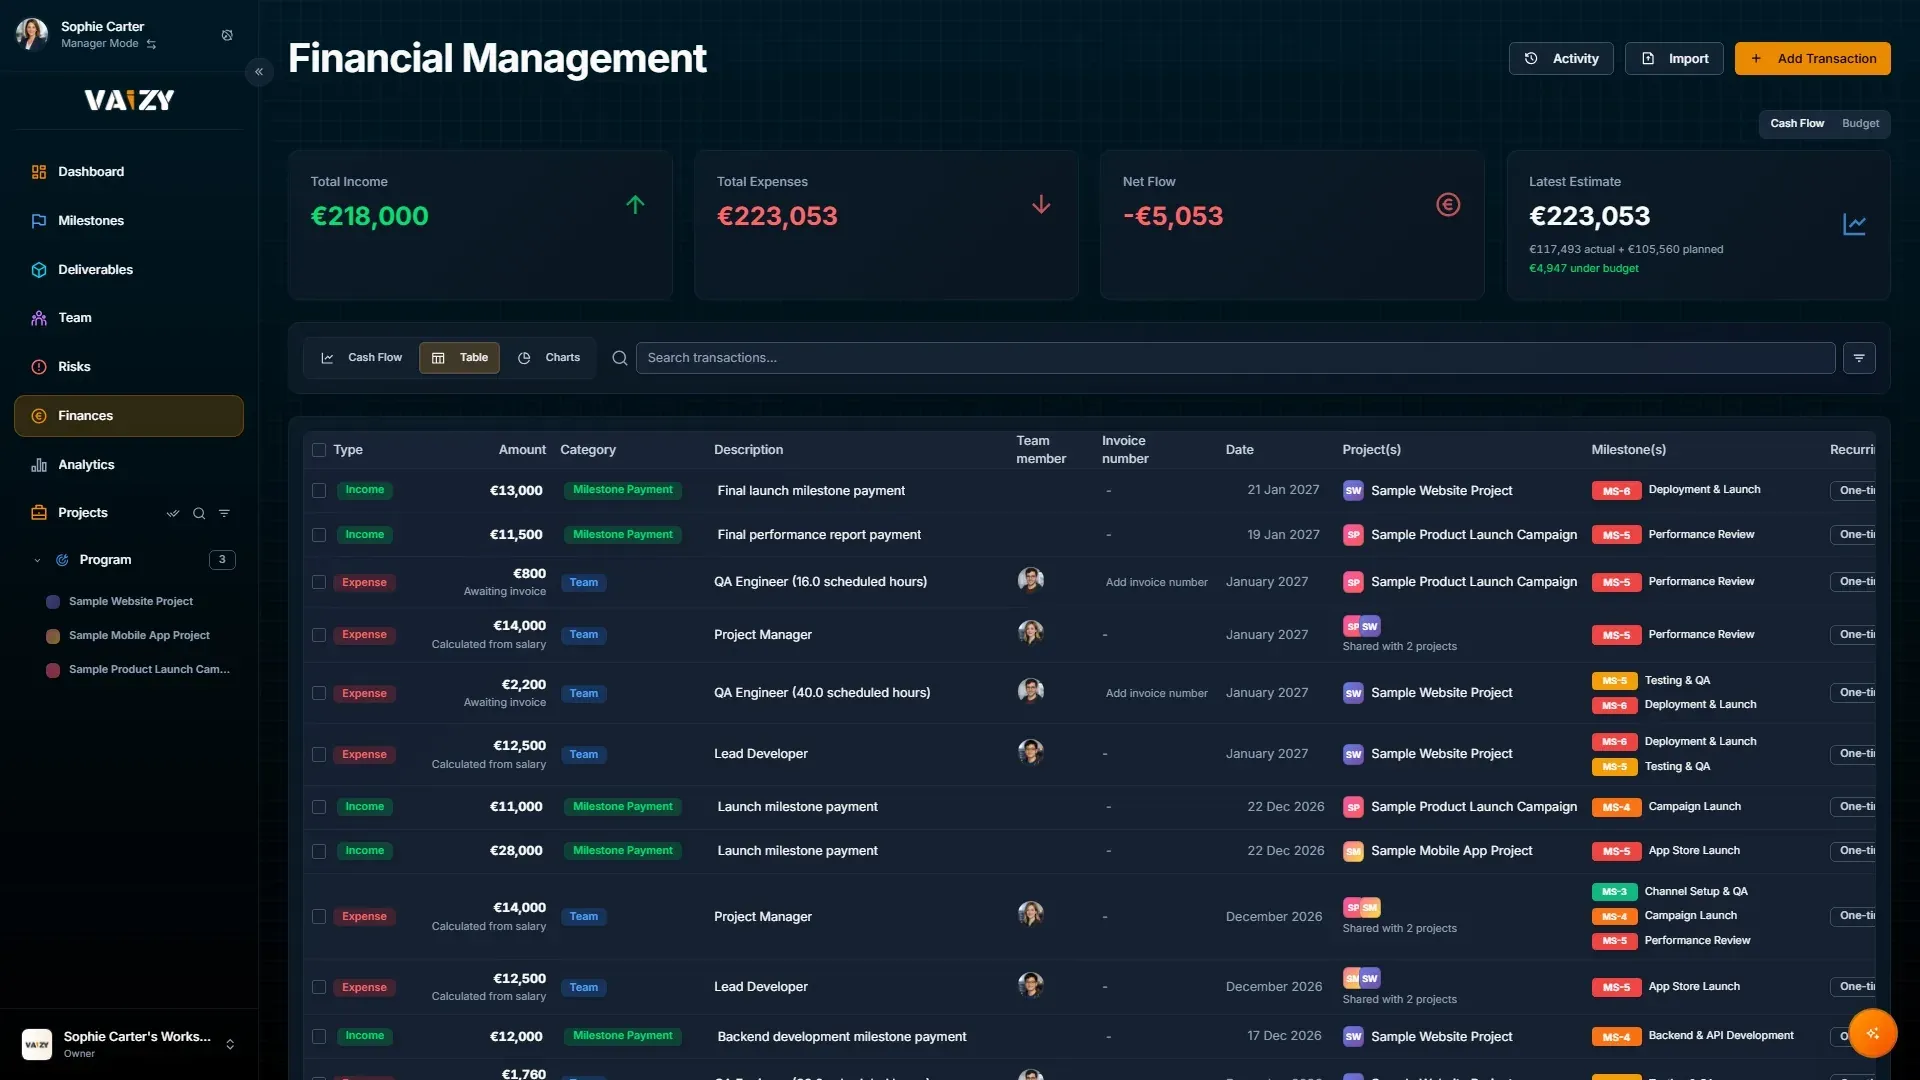
Use the table view for detailed finance work.
Transactions can be:
- Income
- Expense
They can include amount, date, category, description, team member, approval status, an invoice number, and an optional milestone link. Team member and Invoice number each have their own column in the table, and searching also matches a team member's name or an invoice number.
Approval shows as a Pending or Approved status you can change from a dropdown. Add an invoice number to a transaction and it's approved automatically, since an invoiced cost is a confirmed one.
Click the Activity button on the Finances page to see who changed which rows and when, with changed amounts highlighted.
Click a single cell — a description, a status badge, a date, or the + beside an assignee's avatar stack — to change it right there, without opening the full form. Search and filter controls stay together on mobile, instead of the filter row wrapping onto its own line. A phase filter, drawn from each transaction's linked milestone, sits alongside the rest of the filters, and whatever filter, search term, and sort order you set stays in place for the rest of your browser session.
Editing an existing finance row through the full form now autosaves as you make changes, with a small "Saving..." / "Saved" label in the form footer.
The table footer shows summary totals for the transactions in view, matching the same footer totals on Milestones, Risks, Team, and Deliverables.
Portfolio Margin
If you run a consultancy-style workspace, Portfolio Margin shows revenue, cost, profit, and margin per client across your projects, with a profit-by-client chart, so you can see at a glance which clients are actually profitable. You'll find it as a dashboard widget and in the charts view on the Finances page.
Undo a change
Made a mistake? Press Ctrl/Cmd+Z to revert your most recent create, edit, delete, or bulk action on finance rows. Every change shows a success message with an Undo button too, and you'll find an "Undo: " entry in the command palette while there's something to undo. This is a quick safety net for the last few minutes, not a permanent history — entries expire after 5 minutes.
Link money to delivery
Link transactions to milestones when the cost belongs to a specific phase. That gives Analytics the actual cost input needed for EVM. A milestone's own Financial tab now always agrees with its Net Impact figure, including when it shares a salaried team member's cost with other milestones.
Labor income and expenses
Project roles can generate labor expense, labor income, or both.
Contractor rows are preserved across recalculations. Team cost dates show month and year so you can tell which period each row belongs to. If a contractor is removed from a project, finance rows for months where they logged hours are kept. Contractor billing is not prorated across partial months unless you set an explicit schedule override.
When you edit a team member's cost settings, their salary transactions are regenerated automatically, so the finance rows always match the latest compensation without a manual recalculation. If a member is unassigned from a milestone, their salaried cost row no longer stays attached to it — the orphaned row is cleaned up automatically.
Team cost is calculated week by week: a week only uses actual logged hours if you logged time in it, and any other week that month still falls back to scheduled hours. So logging a few hours partway through the month won't wipe out the cost for the rest of it.
Team costs follow each milestone's dates. If a salaried member works on several milestones in the same month, the cost is split between them by the days each milestone covers. A milestone completed early stops generating team costs on its completion date, and deleting a milestone removes the team costs Vaizy generated for it.
This is useful when contractors need to be represented in 2 ways:
- A project expense row for delivery cost.
- A personal income row for the linked member account.
Personal consultant billing income is private to the linked member account. Project expenses remain visible only to people with finance visibility.
Automatically calculated team costs show who they belong to in the Team member column, and their description lists just the role and hours. They're read-only in the transaction form, because the next recalculation would overwrite any edit. The form tells you where to change them instead, such as hours and rates in Team.
Contractor invoices
When a contractor sends you an invoice, record it so it replaces the estimate Vaizy calculates from their hours and rate.
- Add an expense, choose the Contractor invoice category, and pick the contractor under Team member.
- Enter the invoice number and the months it covers in Covers from and Covers until. The form shows which estimated amount the invoice replaces.
- Set the Payment date to when the money leaves your account.
For the months an invoice covers, that contractor's estimated team cost stops counting, so budget, cash flow, earned value, and margin count the cost once. The estimate row stays in the table, struck through and marked "Covered by invoice". Delete the invoice and the estimate counts again.
You can also start from the contractor's team cost row: Add invoice opens a prefilled form. If you already entered the invoice as an ordinary expense, use Convert to contractor invoice on that row instead, so it isn't counted twice.
The budget view shows how much contractor cost is invoiced and how much is still awaiting an invoice. Salary costs are calculated from the salary and aren't matched to invoices.
Finance visibility
Project owners choose which collaborators can see project finances. If you don't have finance access on any project, the Finances menu item is hidden, and opening the page directly explains why it's empty.
The rule is plain:
- Owners always see finances.
- Collaborators see finances only when finance visibility is enabled.
- Existing editors and admins kept finance visibility when the control shipped.
- Existing viewers no longer see finances unless the owner enables it.
- Personal consultant income stays private.
See Billing and subscriptions for VAT verification and invoicing.
Currency
Vaizy supports multiple currency symbols, including CHF. If a transaction uses a different currency from the project default, Vaizy can show the transaction currency as the primary value and a converted equivalent underneath.
Totals follow one simple rule everywhere, from Finances and dashboards to the roadmap, earned value, monthly reports, VaizyAI and Slack. Numbers for a single project are shown in that project's currency. Totals across several projects use the currency those projects share, or your default currency if they differ. Each transaction and budget is converted from its own currency first.
Live exchange-rate conversion is not yet available. Current conversion display uses a static rate reference.
Was this helpful?
Still need help? Ask the team