Analytics and EVM
Analytics gives Vaizy its earned value management layer, plus a portfolio health score. It answers the uncomfortable portfolio questions early: is the planned work getting done, what did it cost, and how healthy is the project overall?
Portfolio Health Index
The Health Index is a single 0-100 score per project, built on the same red/amber/green engine behind the Roadmap view. With more than one project in view, you also get a portfolio-wide score. It's the default tab when you open Analytics, and you can add it to your dashboard as a widget if you're on a Pro plan. The scoring formula behind it gives representative red/amber/green results.
Plan revisions
Plans change. Revisions let you see exactly how. Open the Revisions tab on the Analytics page and click Save revision to freeze the project's current dates, estimates, risks, and budget under a name of your choice.
Vaizy also saves two revisions for you: an "Original plan" when the project starts and a "Final (as delivered)" when it completes.
Pick any two revisions to compare side by side, or compare a revision against the current plan or the plan on a past date. Charts and a milestone table show what moved and whether each milestone now lands early, on time, or late, along with anything added, removed, or changed. Mark the revision you measure against as the baseline, and rename or delete revisions as you go.
Plan revisions are available on Pro and Enterprise plans. VaizyAI can read them too, so you can simply ask "what changed since the baseline?".
The core EVM metrics
Vaizy calculates:
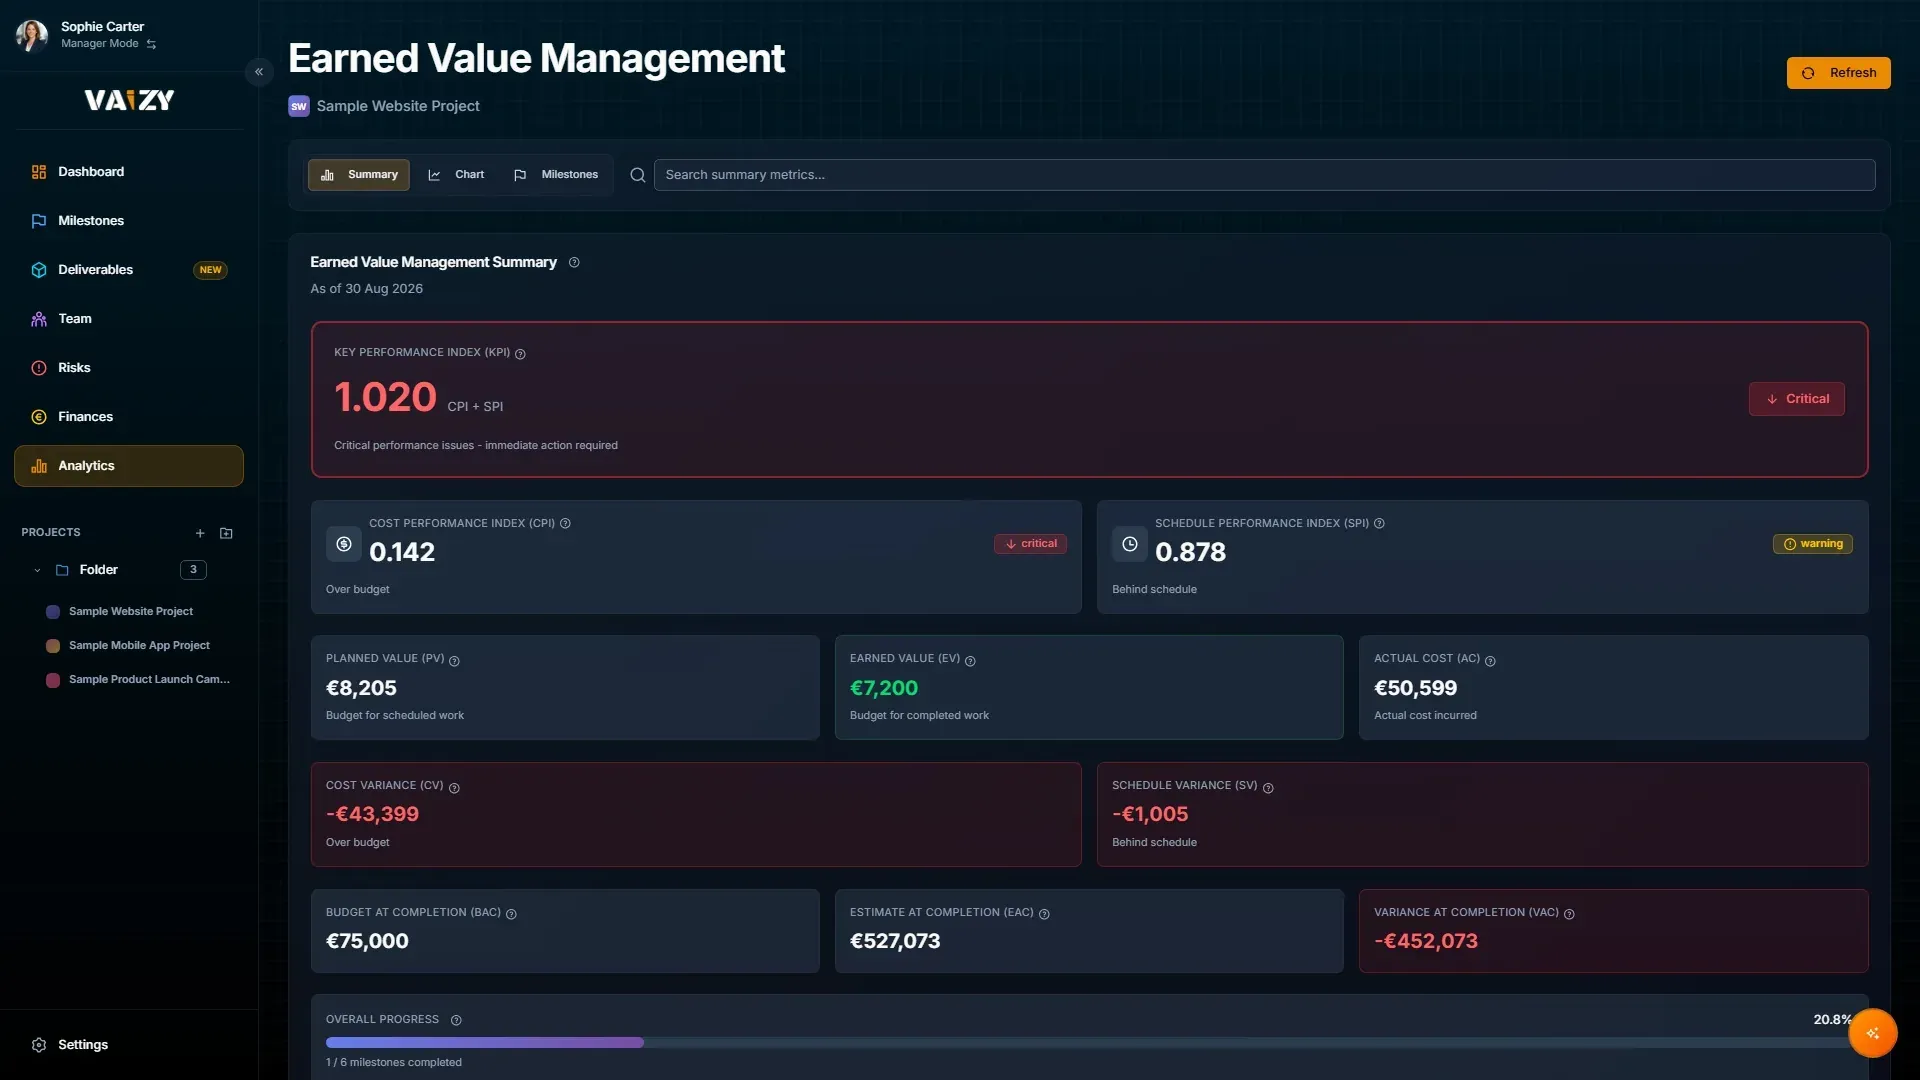
- PV: Planned Value. Budgeted cost of work scheduled by now.
- EV: Earned Value. Budgeted cost of work actually completed.
- AC: Actual Cost. What has actually been spent.
- CPI: Cost Performance Index.
EV / AC. - SPI: Schedule Performance Index.
EV / PV. - CV: Cost Variance.
EV - AC. - SV: Schedule Variance.
EV - PV. - EAC: Estimate at Completion.
- ETC: Estimate to Complete.
- VAC: Variance at Completion.
Above 1.0 is usually good for CPI and SPI. Below 1.0 means the project needs attention.
Inputs
EVM needs 3 things to be useful:
- Milestones with planned dates and budget.
- Deliverables with completion status.
- Financial transactions linked to milestones.
If one of those inputs is thin, the output will be thin too. EVM is not magic. It is math with consequences.
Cancelled milestones are left out of progress and earned value, but anything already spent on them still counts as actual cost. On Hold milestones still count towards progress.
EVM is calculated for one project at a time. If several projects are selected, Analytics asks which one to show. Figures use the selected project's currency. The numbers update automatically when milestone progress or linked financials change. You can also recalculate to refresh them right away. The EVM widgets on the dashboard show the same figures as this page.
S-curves and trends
The chart view plots Planned Value, Earned Value, and Actual Cost over time. The tooltip snaps to the hovered data point and stays in place.
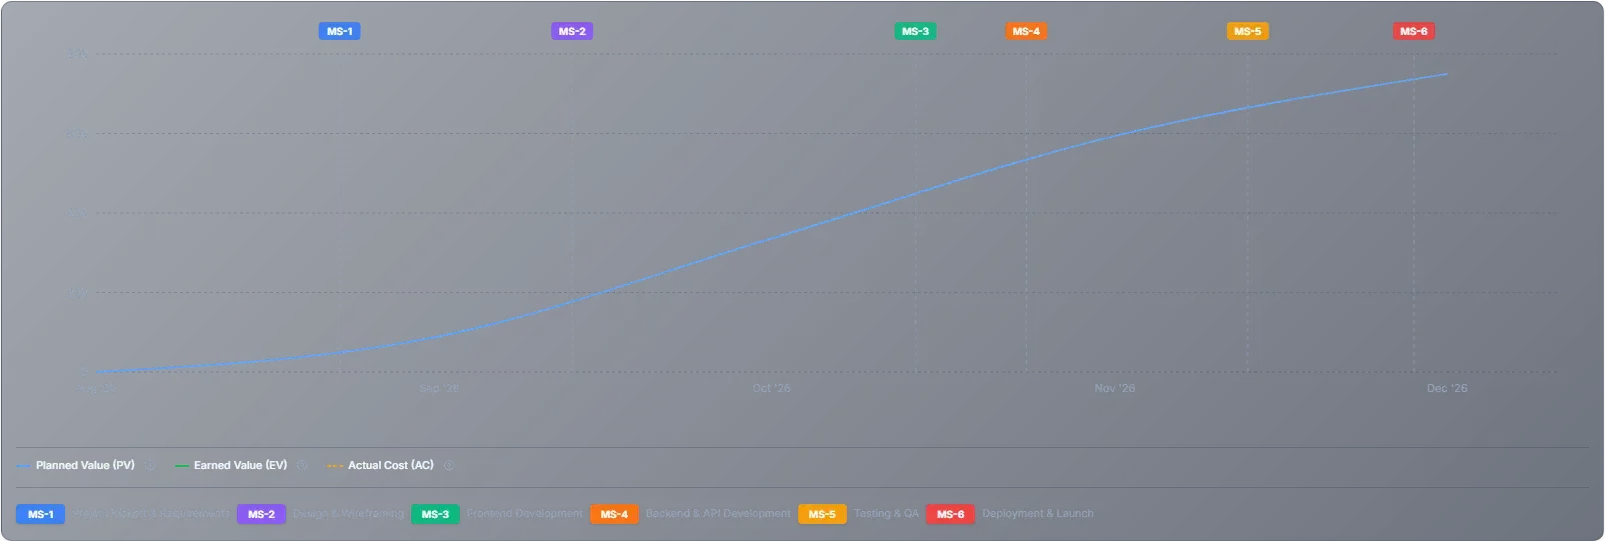
Use trends to see whether performance is improving or degrading. A single bad number can be explained away. A trend is harder to ignore.
Milestone breakdown
The milestone table shows which milestones are driving variance.

Use it before a steering meeting. It shows where the portfolio picture breaks.
Was this helpful?
Still need help? Ask the team