Dashboard
The Dashboard is the first live view of the portfolio. No status deck. No separate risk page. No budget export open in another tab. The main signals sit together and update from the workspace.
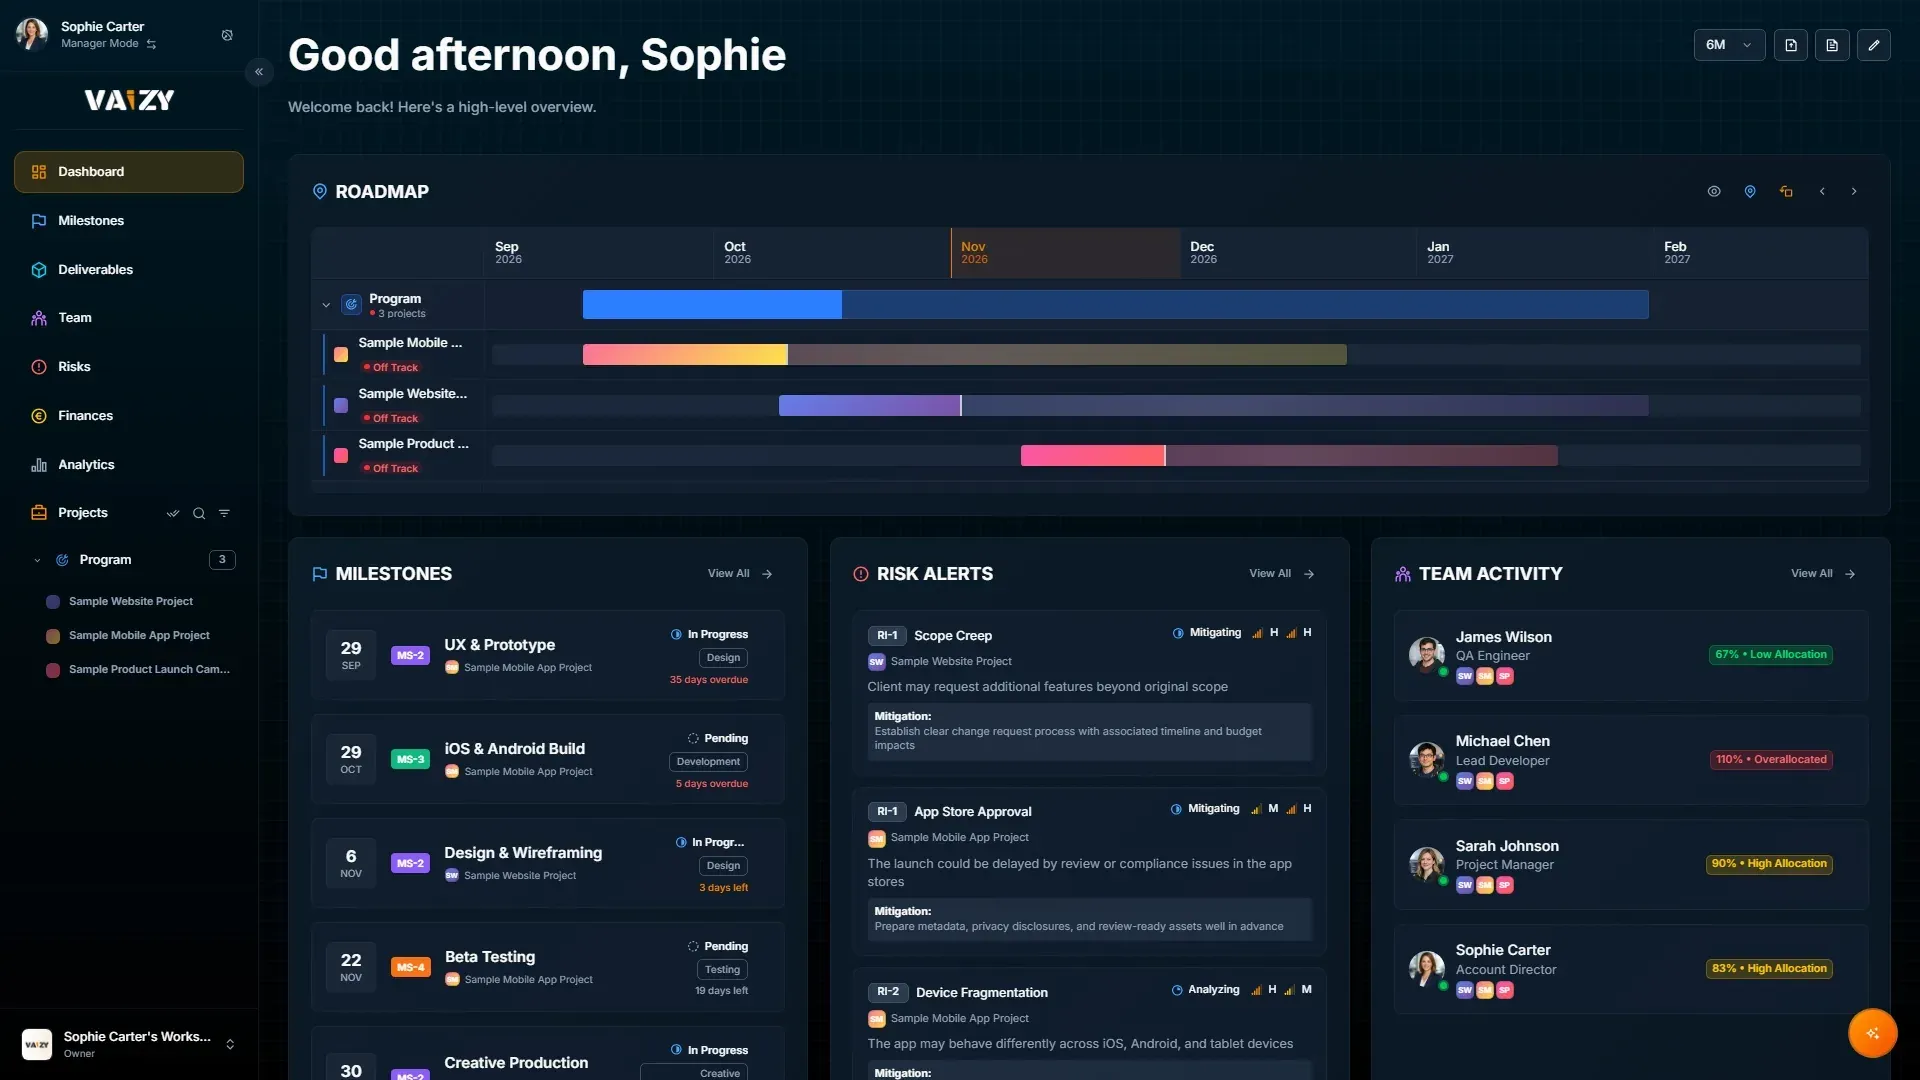
What it shows
The dashboard can include:
- Project roadmap
- Upcoming milestones
- Team activity
- Activity
- Risk alerts
- Cash flow
- Financial category breakdown
- Recent transactions
- EVM summary
- EVM chart
- EVM milestone table
- Pending deliverables
- Recently updated risks
- AI insights
- AI suggestions
- Mini calendar
- Portfolio Health Index
- Portfolio Margin
Each widget reads from the selected project or project selection. When the underlying data changes, the dashboard reflects it.
Work widgets focus on active projects. Upcoming milestones, risk alerts, pending deliverables, the mini calendar, and AI suggestions leave out completed and cancelled projects unless you select those projects yourself. Their money still counts in the financial widgets.
A few widgets are worth calling out:
- Clicking a project row on the Project Roadmap widget filters your dashboard to that project, the same as picking it from the project selector.
- The Cash Flow widget shows a Cash Flow / Budget toggle when the selected project(s) have a budget set. Budget view plots spend to date against a dashed budget line, and the tooltip shows how much budget remains, green when under and red when over.
- Recent Transactions cards are ordered by when each entry was added, show the related milestone when one is linked, and drop the repeated project name when you have narrowed the dashboard to a single project.
- Risk Alerts uses the same VL/L/M/H/VH probability and impact codes as the Risks views, with the full labels shown.
- Recently Updated Risks shows the risks and issues touched most recently, with who last changed each one and what changed. It's available on Pro and Enterprise plans.
- EVM widgets show the same figures as the Analytics page, so the dashboard and Analytics never disagree.
- The Mini Calendar widget shows upcoming milestones and team time-off in a compact view, with a toggle to show milestones, time off, or both. Time off uses the same labels and pending or rejected styling as Team > Calendar.
- Team Activity shows each person's allocation badge (Low, High, or Overallocated, with a percentage) and shows a member as On Leave during approved all-day time off.
- Activity shows the latest changes people made across your dashboard's projects. Click an entry to jump to it. It's available on Pro and Enterprise plans.
- AI Suggestions gives you up to five suggestions drawn from across your projects: milestones at risk, budget or burn concerns, team overallocation, and gaps in your risk register. It refreshes every 30 minutes, or click refresh to update it sooner. It's available on Pro and Enterprise plans.
- Portfolio Health Index shows a 0-100 health score per project, and portfolio-wide when more than one project is in view, on Pro plans.
- Portfolio Margin shows revenue, cost, profit, and margin per client across your projects, useful for consultancy-style workspaces.
Build the view that matches the work
Use Edit to change the layout. The dashboard is a grid: add widgets from the side panel, drag them where you want them, and the other widgets move out of the way. Resize a widget by dragging any of its edges. Layout changes save automatically as you drag, and pressing Escape exits edit mode. Newly released widgets show a one-time "New" badge in the side panel.
Your desktop, tablet, and phone each keep their own layout, so a board built for a big screen doesn't get squeezed onto your phone. On a phone, press and hold a widget to start rearranging.
Good dashboard layouts usually have 3 jobs:
- Show what is late or at risk.
- Show where money is moving.
- Show whether the project is performing against plan.
Charts and timelines usually work best in wide widgets. Lists and summaries work well in smaller ones.
Time windows
Use the time-range control to switch between 3-month, 6-month, 1-year, and 2-year views. Short windows are useful for delivery reviews. Longer windows are better for portfolio planning and EVM trends.
Find anything fast
Press Cmd/Ctrl+K anywhere in Vaizy to open the command palette. Type to search live across projects, milestones, risks, deliverables, and team members, or jump straight to a settings page or action. Commands with a keyboard shortcut show it next to them. Every word you type has to appear in a result, so adding a word narrows the list. If you're in Member Mode, results are scoped to your own projects.
Prefer the keyboard? Press G then a letter to jump to a section right away (G then R for Risks, for example). Press ? at any time to see the full list of shortcuts, including the hover shortcuts on Risk and Deliverable Kanban cards.
Importing data
The dashboard also gives quick access to import, for moving data in from spreadsheets. See Importing data for the full walkthrough.
Was this helpful?
Still need help? Ask the team